
Increasing engagement on your platform, improving your conversion rates and decreasing your bounce rates are inevitably objectives on your radar. To achieve these goals, the performance of your website is a key lever. According to a Google study, with a gain of 0.1 seconds of loading time, conversions can be increased by 8% (and even more in some e-commerce sectors). But to know what to optimize, you first need to know what and how to measure.
One of the tools offered by Google, Lighthouse, allows you to evaluate website performance from different angles: load time, accessibility, SEO… Moreover, the Lighthouse speed score is used by one of the other Google tools: PageSpeed Insights.
So, how should you read these results in order to get the best insights? Should we apply all of Google’s recommendations? Let’s take a look at Lighthouse, and focus on how to use it to optimize your loading times.
What does Lighthouse measure?
Lighthouse evaluates the performance of web pages by displaying 4 scores between 0 and 100. These scores cover:
- Load time (Performance)
The tool takes into account six metrics to evaluate the load time and the quality of the user experience, which we will detail a little further.
In addition to the performance score, Lighthouse also provides optimization tips to improve load time – we’ll come back to that too. - Accessibility
In this section, Lighthouse evaluates compliance with web accessibility best practices such as: the use of ARIA, the importance of contrast on the tested page, the presence of alt tags on images and an accessible version of buttons… In other words, elements that allow visually impaired or blind users to navigate the website, with the help of text-to-speech tools if necessary. This is a selection of criteria; these checks are not intended to replace a full audit of compliance with WCAG. - Best practices for the web
Here, Google checks that the best practices for the web are applied, such as: the use of HTTPS, various security criteria, the absence of errors on the page, the attributes of images … Some of these best practices are directly related to the page’s performance in terms of load time, including HTTPS, the resolution and size of images … - SEO
The SEO score of the Lighthouse report lists a selection of SEO best practices such as the presence and validity of certain meta tags-, the possibility for Google to crawl the links and index the page… This part is not a substitute for an SEO audit, as it does not cover all the criteria that are crucial for good SEO.
In addition, a 5th indicator evaluates the compliance with the eligibility criteria of a Progressive Web App (PWA).
Lighthouse provides a summary of the page tested using scores and easy-to-understand visual cues: green applies to scores between 90 and 100 and is considered good, orange means that the score is average and applies to those between 50 and 89, and red applies to scores between 0 and 49 which are considered poor.

Let’s now see in detail how Google’s Lighthouse tool scores load time, what you need to know about this score that is included in PageSpeed Insights, and how to apply the recommendations to speed up your website’s pages.
How Lighthouse calculates its performance score
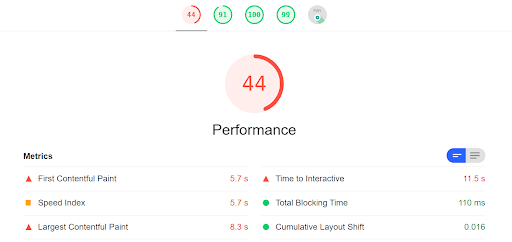
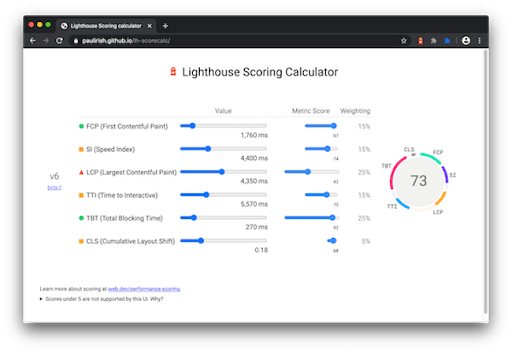
Lighthouse is now in its v6. In this version, 6 indicators are used to measure the loading speed, each with a different weight (*hint* you will recognize Core Web Vitals):
- The Largest Contentful Paint (LCP), one of the Core Web Vitals that evaluates the display speed of the largest element on a web page (25% of the Lighthouse score).
- The Cumulative Layout Shift (CLS), one of the other Core Web Vitals, a score that evaluates the visual stability of a web page (5% of the Lighthouse score).
- Total Blocking Time (TBT), an indicator that accumulates the periods during which a page cannot respond to interactions, based on the observation of Long Tasks (which need more than 50 ms to be executed) in the Main Thread.Total Blocking Time replaces First Input Delay (FID), the Core Web Vitals metric that evaluates interactivity (25% of the Lighthouse score), in Lighthouse’s synthetic tests.
- First Contentful Paint (FCP), which indicates when the first element defined in the DOM is rendered by the browser. This metric excludes iframes and looks at rendering in a technical sense, not in terms of how it looks to the user (15% of the Lighthouse score).
- The Speed Index, which evaluates the speed of loading elements in the viewport, in other words, above the fold (15% of the Lighthouse score).
- The Time To Interactive (TTI), which measures the time it takes for a page to become interactive in a sustainable way, without latency (15% of the Lighthouse score).
You can simulate the impact of the improvement of each metric on your Lighthouse score using the Lighthouse scoring calculator:
(Source: Google)
To collect the data that goes into the calculation of the score, Lighthouse relies on simulated navigation data (what Google calls “lab data”, also known as synthetic data). The browser context used for this is not the optimal configuration, and is not necessarily representative of your audience, but it allows you to estimate your page load speed for users who do not have the latest equipment with the best network conditions. If you have a good score with these browsing parameters, your pages are more likely to be fast for most of your users.
Beware, if you take a close look at your Core Web Vitals, you will see that you can achieve a very good score, without the user experience being 100% satisfactory.
How is this possible? You have probably noticed that the CLS only counts for 5% in the calculation of the Lighthouse score. So, you can have a very good Lighthouse (or PageSpeed) score, and still serve a page with layout changes that will disrupt its usability and display. Although your overall performance score will only be slightly affected, in practice, visual stability is important for a pleasant browsing experience.
So pay attention to all aspects of the user experience: display speed, interactivity, visual stability, as well as server response time… and if you have to make choices, give priority to the metrics that correspond to your business needs.
In short, the scores attributed by Google, whether it is Lighthouse or PageSpeed, have the advantage of giving quick access to a global evaluation of performance, and they are also easy to share in-house with your teams to evangelize the need to optimize load time.
But to better understand the levers for improving the user experience, it is in your interest to observe the details of the metrics (be aware that those retained by Google are not the only ones; depending on what you want to measure, there are others that may be more important, and you can even customize them according to your business needs).
Moreover, if you already rely on PageSpeed Insights… and you wonder what the difference is between these two Google monitoring tools, here are the answers.
What is the difference between Lighthouse and PageSpeed Insights?
As mentioned earlier, the PageSpeed Insights score is based on Lighthouse.
In the PageSpeed Insights results, you will find the Lighthouse score, the lab data (the 6 webperf metrics listed above), as well as field data, which is essential to understand the performance of your web pages for real users.
“Field data”, as Google calls it, is collected via the Chrome User Experience Report (CrUX). This is where you can see the FID of the page we tested, which we mentioned earlier (it’s replaced by the TBT in the lab data).
Because the data are not collected in the same way, the results are likely to vary for the same metric depending on whether you look at the lab or field data.
Also note that field data is collected and analyzed over a 28-day window, so don’t expect an immediate change in your PageSpeed score if you optimize your pages. All good things come to those who wait…
Finally, Lighthouse doesn’t just give you a score, it also helps you improve. But should you follow all the recommendations displayed? Let’s see how to read the audit.
How to read and apply Lighthouse’s recommendations to optimize your loading speed
On the results page, Lighthouse lists recommendations to help you improve the load time of the tested page.
These are best practices and frontend optimization techniques, but not all of them need to be strictly applied. Why not? Because some are not relevant to your technical and business limitations, and others require expertise to be applied while avoiding side effects.
For example, Google recommends the WebP image compression format, but it may not be the best adapted or the most efficient for your website (some sites whose image quality must be very high choose not to use this format, and on the other hand, the AVIF format offers a better compression and a better visual quality).
Google also recommends limiting the impact of third-party code, knowing that some scripts may be essential for your site (technically or in terms of revenue: tracking, A/B test, advertising, chat …). Moreover, coming from third-party publishers, you will not have control over them. The best option is to prioritize your third parties to take advantage of their benefits while preserving the quality of the user experience. This is a fundamental task that is difficult to automate.
Here are two other examples of best practices that should not be applied head-on: preloading key requests (preloading all key requests would lead to a request traffic jam) and lazy loading. If not implemented properly, these optimizations can degrade the user experience.
Also note that, according to tests performed by Fasterize’s webperf experts, the performance gains estimated by Lighthouse are often very (overly) optimistic, even fanciful.
So, as with the application of all webperf techniques, you’ll need to prioritize beforehand. Before launching any developments, call on web performance experts, or better yet, entrust your frontend to an automated optimization solution! You will benefit from the most up-to-date techniques, intelligently articulated in relation to each other to make the most of them.
In a nutshell: What you should know about Lighthouse
- The performance score is an important metric to track over time to measure the impact of the actions you take to optimize your load time.
- You can use it to compare your performance to your competitors who have similar limitations, rather than considering this score as an absolute.
- If you use PageSpeed Insights, be aware that the Lighthouse score it is based on is collected under what are not the most favorable browsing conditions, which makes it a relatively harsh arbiter. For example, note that when looking at 2020 JDN rankings for the most visited sites in France based on their mobile webperf scores, more than half of the sites in the top 10 had a score below 49. Despite their rank as some of the best performing sites, PageSpeed Insights does not consider them to be fast.
- Remember to rely on expert advice before applying the recommendations to speed up your web pages, and consider automating the best practices and webperf techniques. Properly applied, they can contribute to increases in conversions of over 30%.