
CausalImpact is one of the most popular packages used in SEO experimentation. Its popularity is understandable.
SEO experimentation provides exciting insights and ways for SEOs to report on the value of their work.
Yet, the accuracy of any machine learning model is dependent on the input information it is given.
Simply put, poor input data leads to unreliable predictions.
In this post, we will show how reliable (and unreliable) CausalImpact can be. You’ll also learn how to build confidence in your experimental results.
We’ll start with a brief overview of how CausalImpact works. Then, we’ll examine how to evaluate its reliability. Finally, we’ll explore a reproducible methodology to test and improve the accuracy of your own SEO experiments.
What is CausalImpact and how does it work?
CausalImpact is a package that uses Bayesian statistics to estimate the effect of an event in the absence of an experiment. This estimation is called causal inference.
Causal inference estimates if an observed change was caused by a specific event.
It is often used to evaluate the performance of SEO experiments.
For instance, when given the date of an event, CausalImpact (CI) will use the data points before the intervention to predict the data points after the intervention. It will then compare the prediction to the observed data and estimate the difference with a certain confidence threshold.
Furthermore, control groups can be used to make the predictions more accurate.
Different parameters will also have an impact on the accuracy of the prediction:
- Size of the test data.
- Length of the period prior to the experiment.
- Choice of the control group to be compared against.
- Seasonality hyperparameters.
- Number of iterations.
All these parameters help to provide more context to the model and enhance its reliability.
Why is evaluating the accuracy of SEO experiments important?
In the past years, I have analyzed many SEO experiments and something struck me.
Many times, using different control groups and timeframes on identical test sets and intervention dates yielded different results.
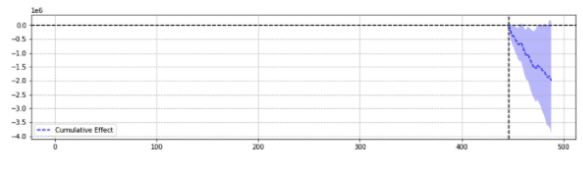
For example, below are two results from the exact same event.
The first analysis returned a statistically significant decline.
The second was not statistically significant.
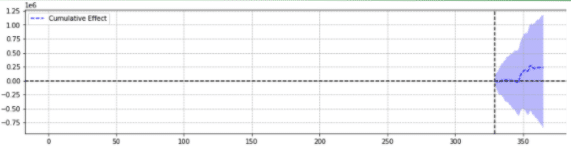
Simply put, this example shows that for the same event, different results were returned based on the chosen parameters.
One has to wonder: Which prediction is actually accurate? Isn’t “statistically significant” supposed to increase confidence in our conclusions?
Definitions
To better understand the world of SEO experiments, the reader should be aware of the basic concepts of SEO experiments:
- Experiment: a procedure undertaken to test a hypothesis. In the case of causal inference, it has a specific start date.
- Test group: a subset of the data to which a change is applied. It can be an entire website or a portion of the site.
- Control group: a subset of the data to which no change was applied. You can have one or multiple control groups. This can be a separate site in the same industry or a different portion of the same site.
The example below will help illustrate these concepts:
Modifying the title (experiment) should increase organic CTR by 1% (hypothesis) of the product pages in five cities (test group). The estimations will be improved using an unchanged title on all the other cities (control group).
Pillars of accurate SEO experiment prediction
- For simplicity, I have compiled a few interesting insights for SEO professionals learning how to improve the accuracy of experiments:
- Some input in CausalImpact will return wrong estimations, even when statistically significant. This is what we call “false positives” and “false negatives.”
- There is not a general rule that governs which control to use against a test set. An experiment is required to define the best control data to use for a specific test set.
- Using CausalImpact with the right control and the right length of pre-period data can be very precise, with the average error being as low as 0.1%.
- Alternatively, using CausalImpact with the wrong control can lead to a strong error rate. Personal experiments showed statistically significant variations of up to 20%, when in fact there was no change.
- Not everything can be tested on. Some test groups almost never return accurate estimations.
- Experiments with or without control groups need different lengths of data prior to the intervention.
Not all test groups will return accurate estimations
Some test groups consistently yield inaccurate predictions. These should generally be avoided in experiments.
For instance, test groups with large abnormal traffic variations often return unreliable results.
Imagine a site that had:
- A major migration;
- Was impacted by Google’s Helpful Content Updates;
- And experienced a weeks-long “noindex” error.
Running an experiment on such unstable data is likely to produce unreliable or misleading results.
These insights are based on a series of extensive experiments, using the methodology described in the next section.
When not using control groups
- Using a control instead of a simple pre-post can increase up to 18 times the precision of the estimation.
- Using 16 months of data prior was as precise as using 3 years.
When using control groups
- Using the right control is often better than using multiple controls. However, a single control increases the risks of wrongful prediction in cases where the control’s traffic varies a lot.
- Choosing the right control can increase the precision by 10-fold (e.g., one reporting +3.1% and the other +4.1% when in fact it was +3%).
- Most correlated traffic patterns between test data and control data do not necessarily mean better estimations.
- Using 16 months of data prior was NOT as precise as using 3 years.
Beware of the length of data prior to experiments
Interestingly, when experimenting with control groups, using 16 months of data prior can cause a very intense error rate.
In fact, errors can be as large as estimating a 3x increase of traffic when there were no actual changes.
However, using 3 years of data removed that error rate.This comes in contrast with simple pre-post experiments where that error rate was not increased by increasing the length from 16 to 36 months.
That doesn’t mean that using controls is bad. It’s quite the contrary.
It simply shows how adding control impacts the predictions.
This is the case when there are big variations in the control group.
This takeaway is especially important for websites that have had abnormal traffic variations in the past year (critical technical error, COVID pandemic, etc.).
How to evaluate the CausalImpact prediction
Now, there is no accuracy score built in the CausalImpact library. So, it has to be inferred otherwise.
One can look at how other machine learning models estimate the accuracy of their predictions and realize that the Sum of Squares Errors (SSE) is a very common metric.
The sum of squares errors, or residual sum of squares, calculates the sum of all (n) differences between the expectations (yi) and the actual results (f(xi)), squared.
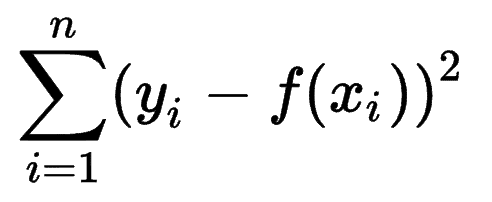
The lower the SSE, the better the result.
The challenge is that with pre-post experiments on SEO traffic, there are no actual results.
Although no changes were made on-site, some changes may have happened outside of your control (e.g., Google Algorithm update, new competitor, etc.). SEO traffic doesn’t vary by a fixed number either but varies progressively up and down.
SEO specialists may wonder how to overcome the challenge.
Introducing fake variations
To be certain of the size of the variation caused by an event, the experimenter can introduce fixed variations at different points in time, and see if CausalImpact successfully estimated the change.
Even better, the SEO expert can repeat the process for different test and control groups.
Using Python, fixed variations were introduced to the data at different intervention dates for the post-period.
The sum of squares errors was then estimated between the variation reported by CausalImpact and the introduced variation.
The idea goes like this:
- Choose a test and control data.
- Introduce fake interventions in the real data at different dates (e.g., 5% increase).
- Compare the CausalImpact estimations to each of the introduced variations.
- Compute the Sum of Squares Errors (SSE).
- Repeat step 1 with multiple controls.
- Choose the control with the smallest SSE for real-world experiments
The methodology
With the methodology below, I created a table that I could use to identify which control had the best and worst error rates at different points in time.
First, choose a test and control data and introduce variations from -50% to 50%.
Then, run CausalImpact (CI) and subtract the variations reported by CI to the variation you actually introduced.
After, compute the squares of these differences and sum all the values together.
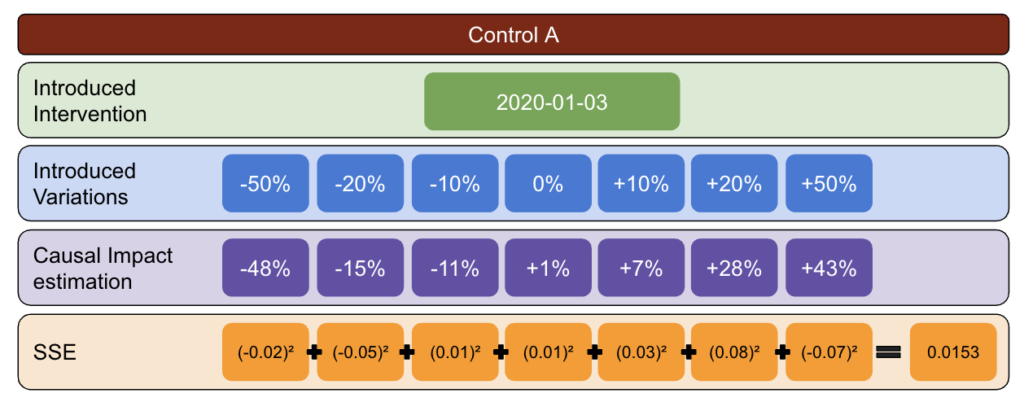
Next, repeat the same process at different dates to reduce the risk of a bias caused by a real variation at a specific date.
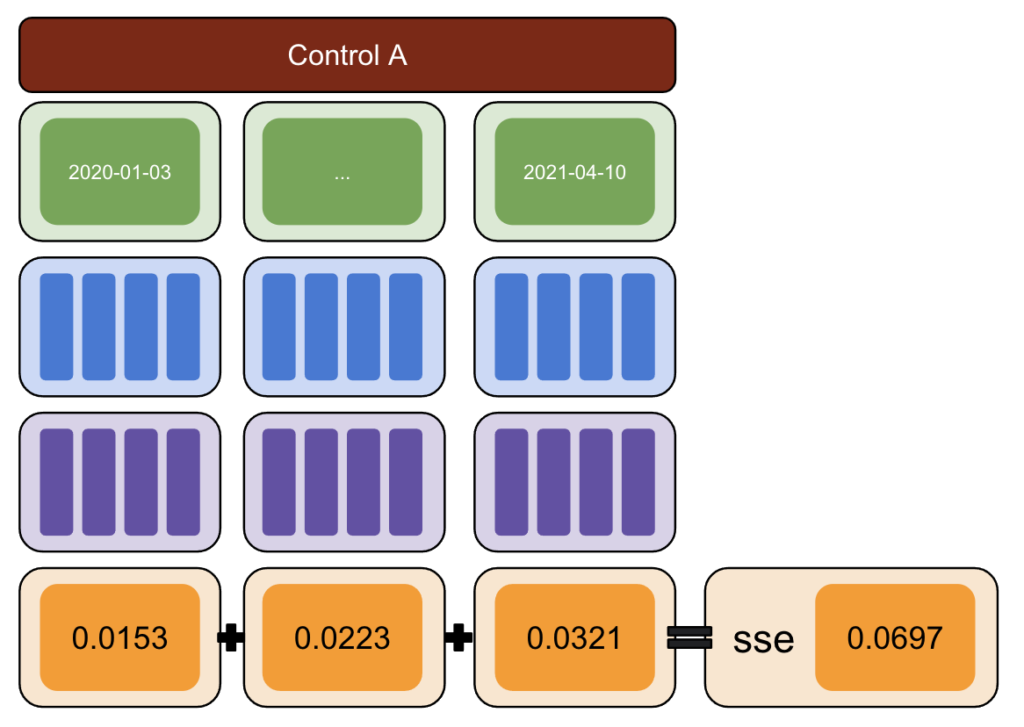
Again, repeat with multiple control groups.
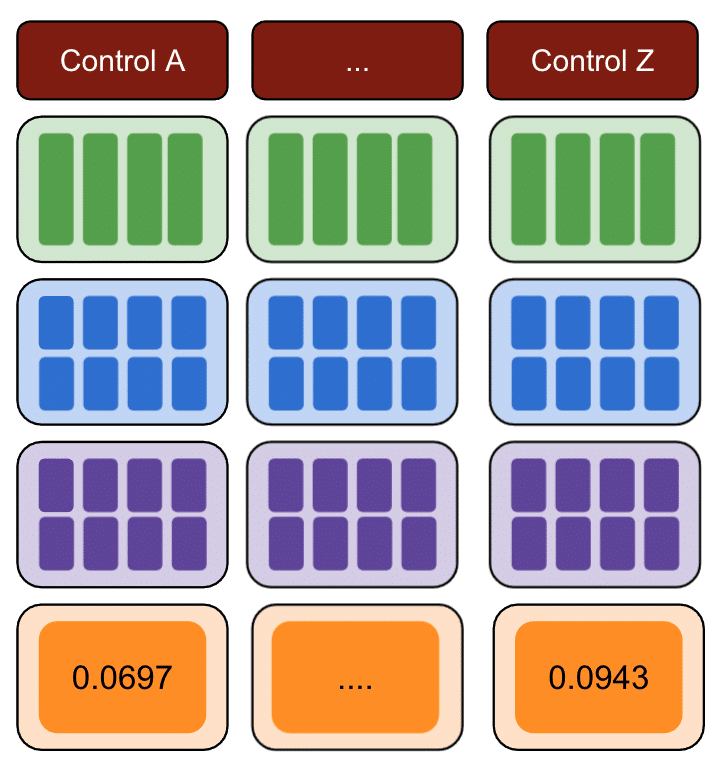
Finally, the control with the smallest sum of squares errors is the best control group to use for your test data.
If you repeat each of the steps for each of your test data, the result will vary.
On the resulting table, each row represents a control group, each column represents a test group. The data inside is the SSE.
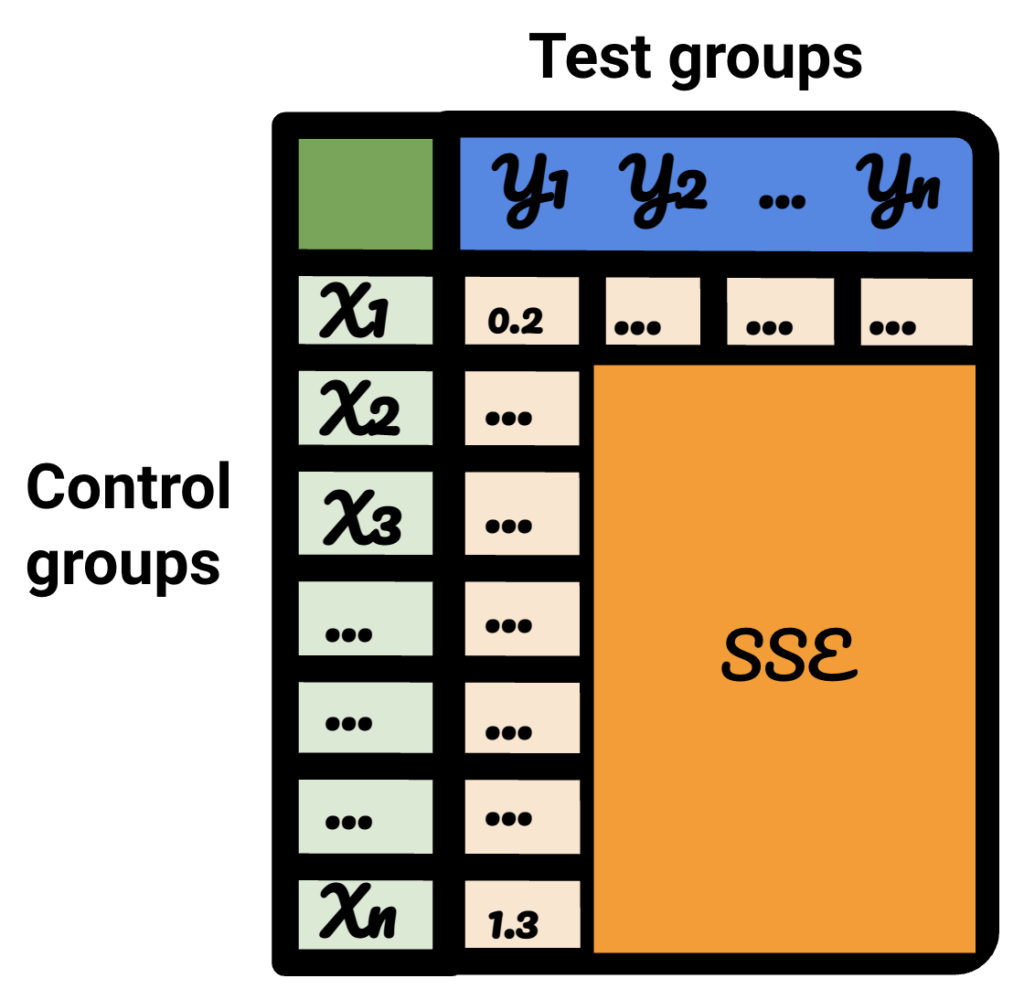
Sorting that table, I am now confident that, for each of the test groups, I can select the best control group for it.
Should we use control groups or not?
Evidence shows that using control groups helps to have better estimations than simple pre-post.
However, this is true only if we choose the right control group.
How long should the period of estimation be?
The answer to that depends on the controls that we are selecting.
When not using a control, 16 months prior experiment seems enough.
When using a control, using only 16 months may lead to massive error rates. Using 3 years helps reduce the risk of misinterpretation.
Should we use one control or multiple controls?
The answer to that question depends on the test data.
Very stable test data can perform well when compared against multiple controls. In this case, this is good because using a lot of control makes the model less impacted by unsuspected fluctuations in one of the controls.
On other datasets, using multiple controls can make the model 10-20 times less precise than using a single one.
Interesting work in the SEO community
CausalImpact isn’t the only library that can be used for SEO testing, nor is the above methodology the only solution for evaluating prediction accuracy.
For alternative approaches and tools, check out recent contributions from the SEO and data science communities:
- Andrea Volpini explored measuring SEO effectiveness using CausalImpact.
- Daniel Heredia covered Facebook’s Prophet package for forecasting SEO traffic with Prophet and Python.
- Sandy Lee shared interesting insights in a BrightonSEO presentation about Data Science for SEO Testing and he discussed some of the pitfalls of SEO testing.
- Libraries like DoWhy and EconML have grown in popularity, offering more robust causal inference frameworks for those with advanced data science capabilities.
While Prophet is better suited for forecasting than experimentation, understanding multiple libraries strengthens your ability to test, forecast, and explain SEO performance.
Things to consider when doing SEO experiments
- Third-party SEO split-testing tools are great but can be inaccurate too. Be thorough when choosing your solution.
- Although I wrote about it in the past, you can’t do SEO split-testing experiments with Google Tag Manager, unless server-side. The best way is to deploy through CDNs.
- Be bold when testing. Small changes are not usually picked up by CausalImpact.
- SEO testing shouldn’t always be your first choice.
- There are alternatives to testing smaller changes like title tags. Google Ads A/B tests or on-platform A/B tests. Real A/B tests are more accurate than SEO split-tests and usually provide more insights into the quality of your titles.
- Factors like AI-generated answers and zero-click SERPs have made organic traffic patterns less predictable. This adds complexity but also underscores the importance of validating experimental data before interpreting results.
Reproducible results
In this tutorial, I wanted to focus on how one could improve the accuracy of SEO experiments without the burden of knowing how to code. Moreover, the source for the data can vary, and each site is different.
Hence, the Python code that I used to produce this content was not part of the scope of this article.
However, with the same logic, you can reproduce the above experiments.
Conclusion
If you had only one takeaway to get from this article, it would be that CausalImpact analysis can be very accurate, but can always be way off.
It is very important for SEOs wishing to use this package to understand what they are dealing with. The result of my own journey is that I wouldn’t trust CausalImpact without testing out the accuracy of the model on the input data first.