
Analytics data is an important addition to a technical SEO analysis: it allows you to contextualize and prioritize by revealing the relationship between technical SEO and the behavior of users who found your site through an organic channel.
If you want to cross-analyze technical SEO data and analytics data in Oncrawl, we’re ready for you. If you’ve migrated to GA4, or if you use Piano (AT Internet) or Adobe Analytics, you can use our native connectors. But what if your site has implemented a different solution, such as Matomo or Plausible.io? Don’t worry: you can still use analytics metrics from whatever solution you use to cross-analyze your data in Oncrawl.
Let’s see how to do that using data ingestion.
- First, we’ll start by exporting the right information from your analytics solution – we’ll be using Matomo as an example.
- We’ll see how to format the export for data ingestion.
- We’ll integrate this export into Oncrawl and associate it with a crawl.
- Additionally, we’ll look at how to analyze the data in Oncrawl.
- Finally, we’ll suggest a few ways to automate the process.
Exporting data from an analytics solution
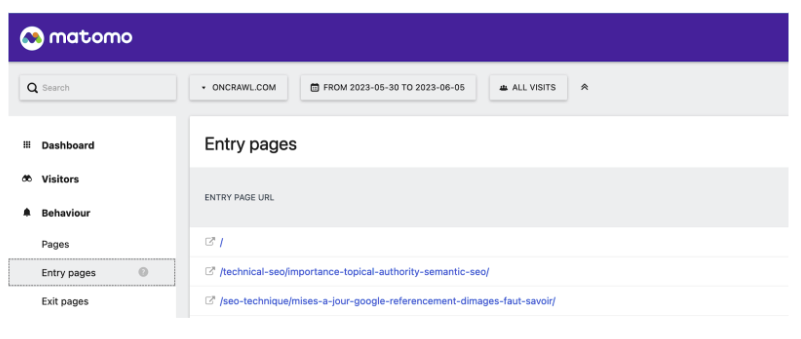
In Matomo, what you’re looking for are pages that visitors click on from the search results pages of a search engine (a SERP), in other words, landing pages. The report can be found under Behavior > Landing pages.
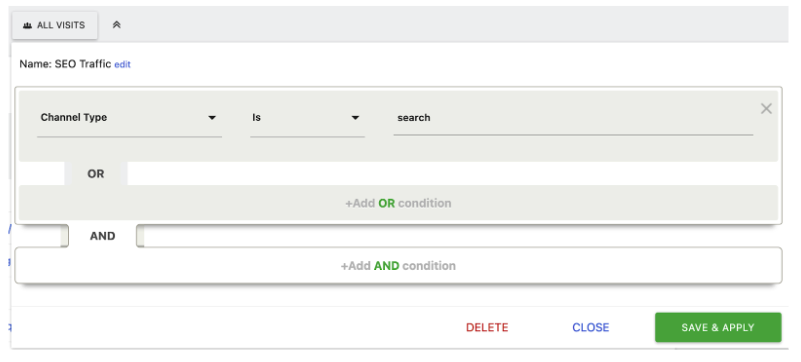
Because I’m only interested in visitors coming from a SERP, I want to look specifically at a segment of visits coming from a search engine.
If you haven’t set that up yet, here’s what it should look like: I’ve filtered by Acquisition channel > Search. I’ve called this segment “SEO visits” but you might have a different name for yours.
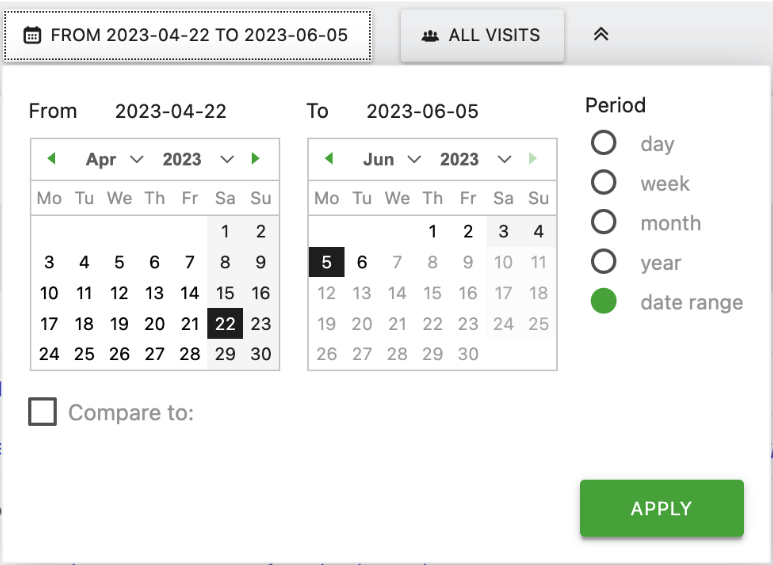
I’m going to cross-analyze this with crawl data. To have results similar to those of the Oncrawl analytics connectors, I’ll want to use the same period of 45 days before the crawl.
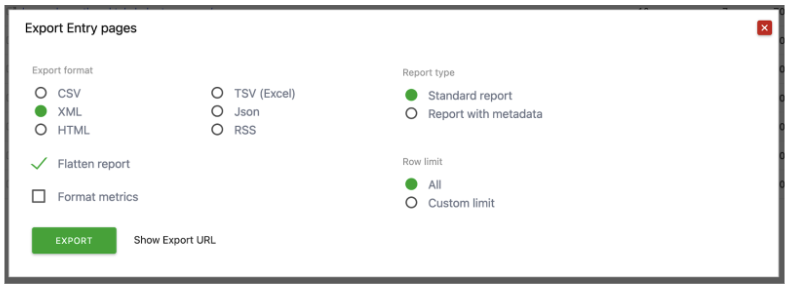
Now, I can export this report. Make sure that you’re exporting the full report, not just the first 100 lines.
Great: now we just need to prepare the CSV file.
Preparing a CSV file for data ingestion in Oncrawl
We’re going to make three main changes:
- We’ll remove data we don’t need.
- We’ll rename the columns to avoid errors and make this process repeatable, since these will become your metric or field names in Oncrawl.
- And, we’ll make sure that numbers are formatted as numbers, rather than text characters.
When I open this in Excel, I’ll need to convert it. I can do that under Data > Text to columns. A CSV file is “delimited”, meaning that fields are separated by a specific character, in this case, a comma.
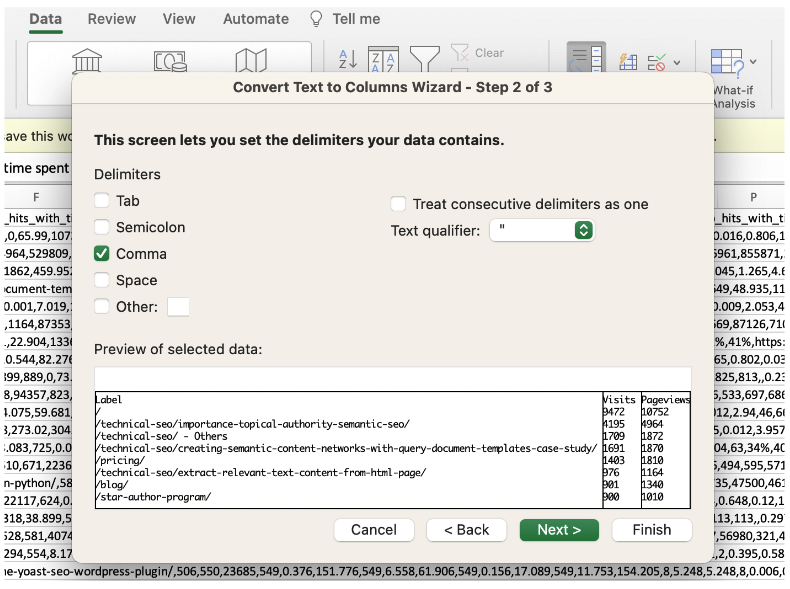
The main data I want to conserve, if I want to obtain the same information as the old Oncrawl Google Analytics (Universal Analytics), will be the URL, the number of entrances (Column W) and bounce rate (Column AM).
Note: You have the option to keep additional data depending on your specific needs or objectives. For our example, I’ll delete everything else.
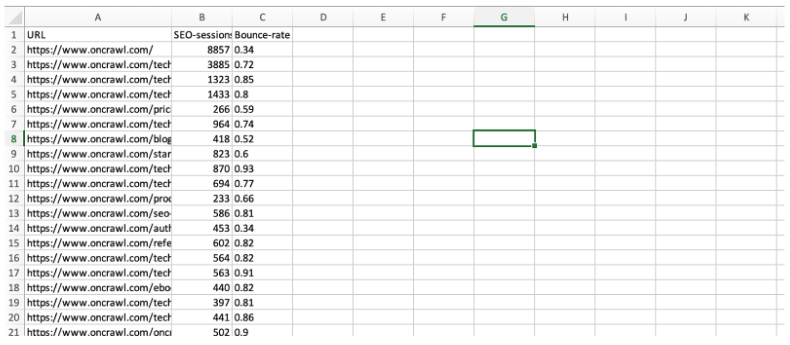
Now, I’ll rename the columns. The first column with the URL in it must be called “URL”. The other column headers can’t contain accents, special characters, or spaces. Let’s name them “SEO-sessions” and “Bounce-rate”. These will be the names of my fields in Oncrawl.
First, I’m going to add the domain to my landing pages. I did this with the formula “=CONCAT(“https://your-domain.here”;A2)”, and then I pasted the text only (use “Paste special” in Excel) of the result over the landing page paths.
Then, I’m going to re-format the columns with numbers in them as numerical values. By right-clicking, I can choose “Format cells”. I’ll choose “number” for this one – these are whole numbers, so I’ll remove the automatic decimal places.
The bounce rate is a little more complicated. The idea is to express the percentages as decimal values. If your bounce rate is formatted like this: a number, a space, and then a percent sign, one way to do this is to:
- Remove the space with a find and replace.
- Format the column as a percentage.
- Then reformat it as a decimal number with two decimal places.
Note: If, like me, your computer lives in a region where the decimal places are set off with a comma instead of a period, you’ll need to replace the comma with a period.
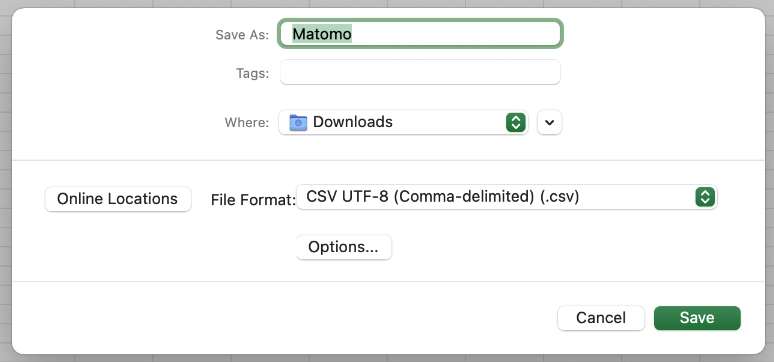
Save the file. We’ll call it Matomo followed by today’s date, and choose the format CSV UTF-8 (comma-delimited).
Now, we can zip it and import it into Oncrawl.
Ingesting data in Oncrawl
From your project page, click on “Add data sources” and switch to the “Data ingestion” tab. Drag and drop your zipped Matomo file here.
When it’s processed, you should see it here.
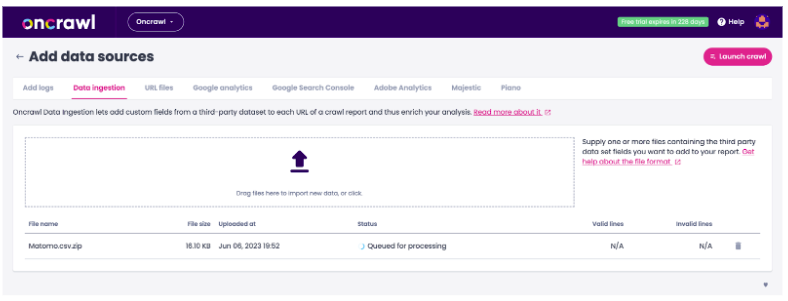
Now we can head over to the crawl setup for your analytics ingestion profile. Under data ingestion, choose the file you just uploaded.
Here’s our word of warning: since your analytics data changes with every crawl, you’ll need to make sure you update this file before every crawl.
Finally, save and launch the crawl.
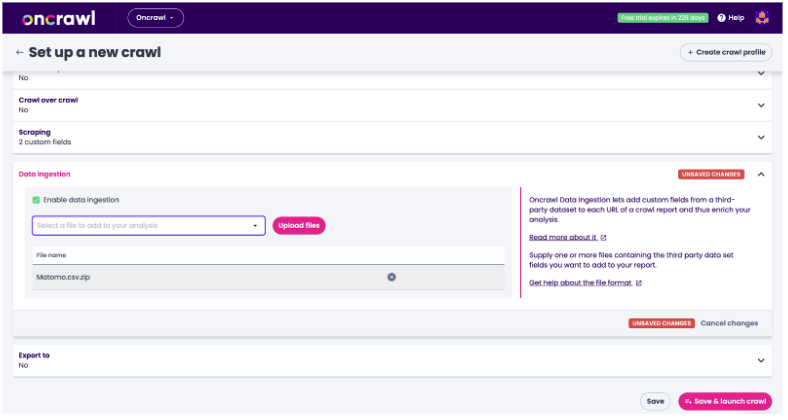
Analyzing ingested analytics data
When the crawl is complete, you’ll be able to view your analytics data across the different platform tools:
- URL Details, which lists all of the information that Oncrawl has collected for a single URL.
- Data Explorer, which allows you to create detailed reports based on any of the metrics on the Oncrawl platform.
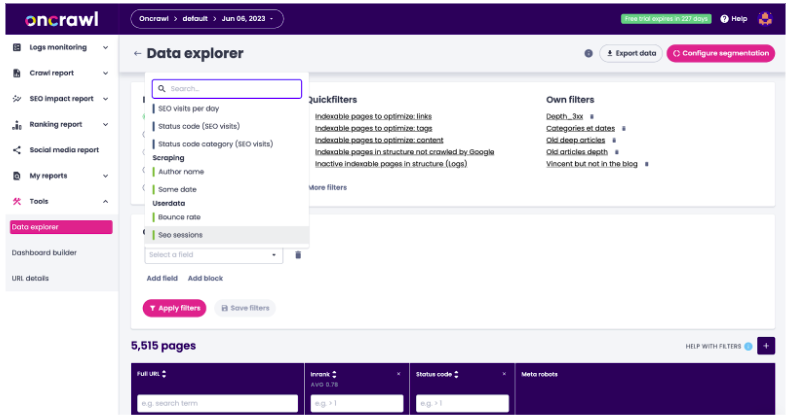
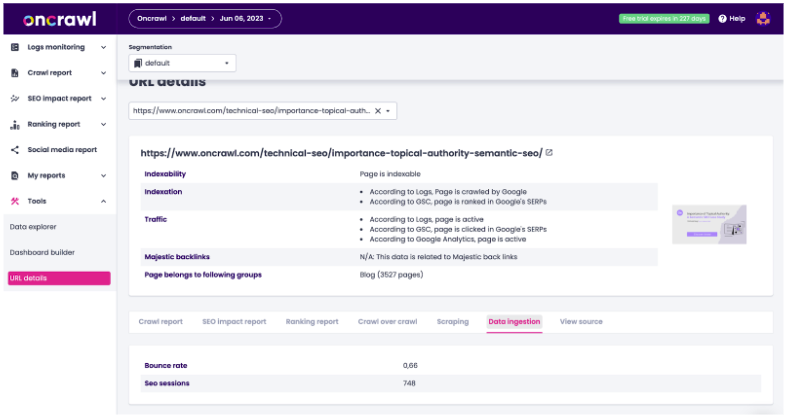
It’s important to mention that you can actually take analyses much further by cross-analyzing your analytics data with crawl data. To do that, once your crawl has finished, you will want to create at least one segmentation to view the data in Oncrawl charts.
This is one of the only situations where you need to wait until a crawl is complete before building a segmentation, since we don’t know what you’ve called your fields – or even what fields you’ve chosen to ingest – until we process the crawl analysis.
This is also why it’s important to always name your columns the same way each time you do this. That will ensure that you can continue to use the exact same segmentations with any analysis that includes this type of ingested analytics data.
Here are some examples of segmentations you’ll need if you want data similar to what you’ll see using Oncrawl’s native analytics connectors:
- In this first segmentation, I’ve recreated the standard binning by range of SEO visits: 0 visits, 1-9 visits, 10-99 visits, etc. This is per-URL, during the 45-day period I chose earlier for the Matomo export.

- In the second one, I’ve created two categories: SEO active pages, which have any value in this new session field – other than 0 – whether that’s 1 or 10 000; and inactive pages, which are the pages that didn’t show up in the Matomo export.
- You can also create a segmentation by binning by bounce rate.
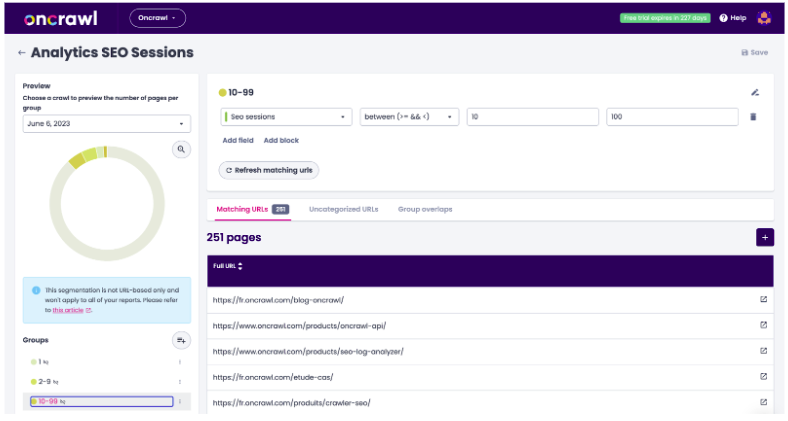
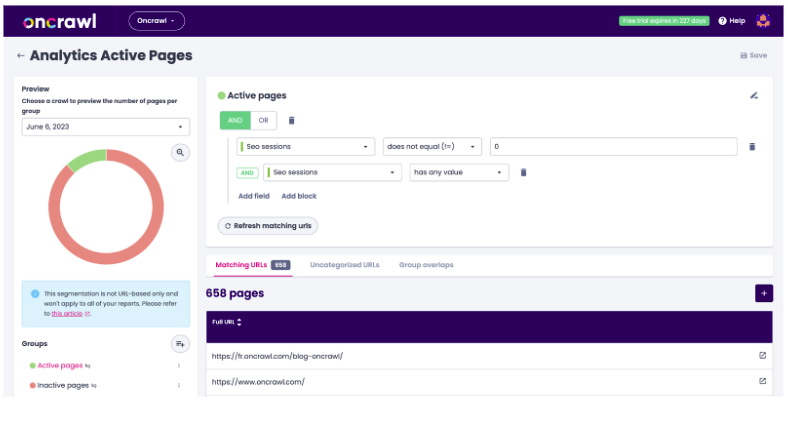
Let’s look at some of the existing charts we can recreate using these segmentations. Oncrawl provides a lot of information by blending sessions and active pages with other metrics on the platform:
- Depth
- Inrank
- Inlinks
- Tag evaluation
- Word count
- Duplicate content evaluation
- Load time evaluation
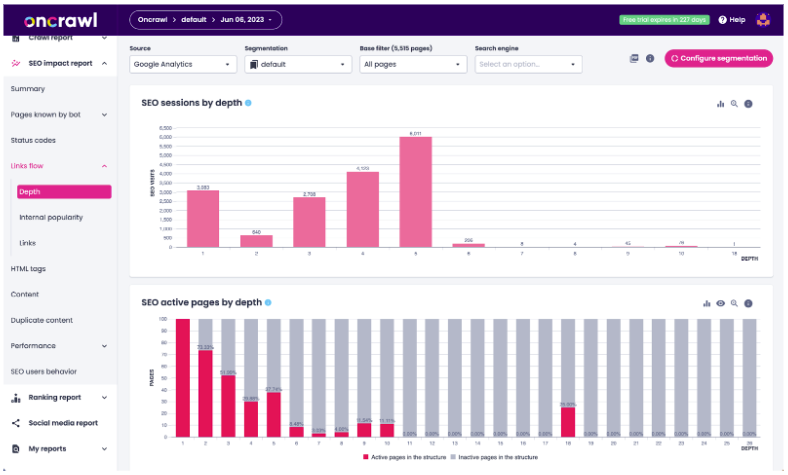
Sessions by depth and SEO active pages by depth: Google Analytics – UA connector
All of those – and more – are compatible with these segmentations. Here’s an example of what that looks like with ingested data.
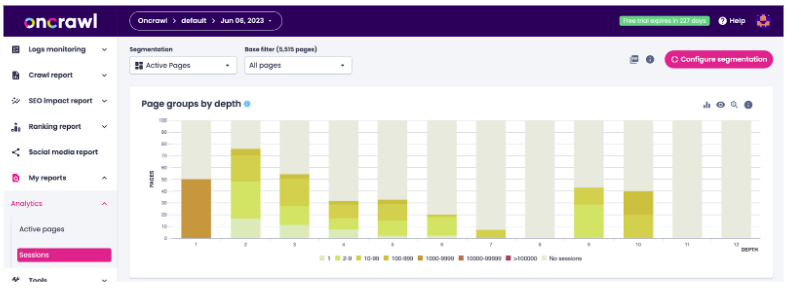
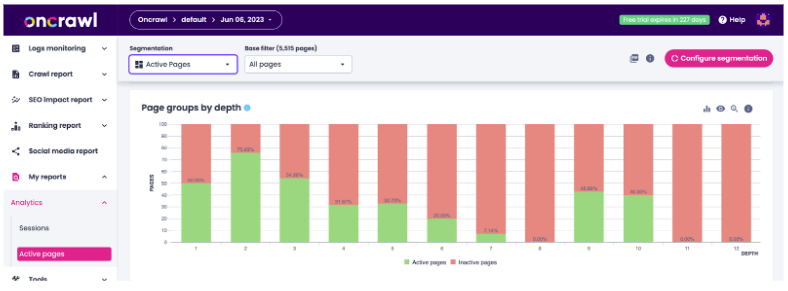
Sessions by depth and active pages by depth – Matomo ingestion with segmentation and custom dashboard
You can download these custom dashboards at the end of the article – there’s one for Sessions with an “SEO Sessions” segmentation, and one for Active pages with an “Active Pages” segmentation. You’ll need to update the segmentations to match yours.
You can also use the Data Explorer to find metrics, and save them as Own Filters. Here are few examples of information you can find in the Data Explorer but that aren’t shown in the custom dashboard charts:
- The total number of SEO visits.
- The number of visits from SEO orphan pages.
- The average number of sessions per active page.
- Number of active pages returning a 404.
You’ll recognize many of these from the SEO Impact report’s summary dashboard.
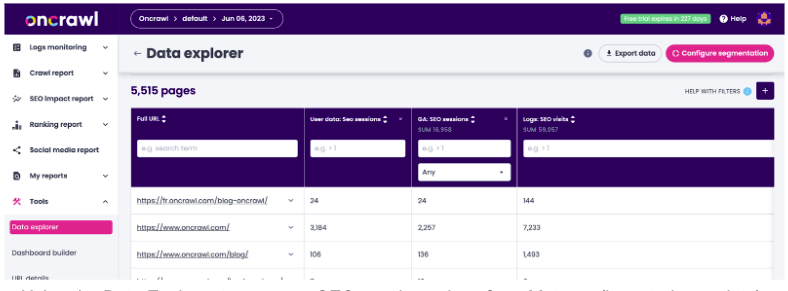
Using the Data Explorer to compare SEO session values from Matomo (ingested user data), GA-UA, and server log data
Automating import and cross-analysis of analytics data in Oncrawl
Finally, if this is something you want to do for regular analysis, you will likely want to automate some, or all, of these steps. Here are a bunch of clues as to where to start:
- Matomo has an API, which can be used to programmatically obtain the export data. You can find the API documentation on the Matomo website (https://developer.matomo.org/api-reference/reporting-api#Live).
- Scripts – or even macros – can be very helpful when you have a sequence of actions like the ones we carried out on the spreadsheet.
- You can use Oncrawl’s API to update your crawl profile and then run a new crawl. If you’re an API user and you’re working on this, talk to your Customer Service expert and we’ll share an example code notebook.
- And, you can schedule these steps to run regularly.
Driving SEO wins through user behavior
This is what analytics is all about: making sure that the changes we make to websites impact user behavior in the ways we intended.
The data ingestion feature in Oncrawl ensures that analytics data from any source can be blended with technical SEO data collected natively on the platform. It can also be used to add any metrics – for example, custom metrics in GA4 – that aren’t included by default in Oncrawl’s connectors.
Once you understand how technical SEO data and organic user behavior are related, you’ll be able to judge which SEO projects can have the most impact on users.
(And don’t forget to download the free Oncrawl segmentations and dashboards!)